I recently acquired an HP 8590B Spectrum Analyzer. This is a late 80's? vintage spectrum
analyzer capable of doing 9 khz thru 1.8 GHz measurements. The unit I acquired has an HPIB
(aka GPIB) interface on it, so captures can be take from it. Using a USB to GPIB board from
Spark Fun Electronics with
KE5FX's GPIB Toolkit I can capture plots from the spectrum analyzer
Once I got the GPIB and computer plotter capture working I needed some interesting things to take pictures of. So, hooked up the spectrum analyzer to a discone @ 20 feet at my location in Round Rock. The plots below are what I captured.
The plot below is 50-200 Mhz. The FM broadcast band (88-108 Mhz) can be clearly seen The double peak towards the right of the plot is KTBC (Channel 7) an analog TV station.

The FM broadcast band as seen from my location (Round Rock). Sure looks crowded.

The plot below is an averaging plot of KUT, 90.5 FM. The two square sidebands are interesting probably some sort of digital data. Wonder if KUT is now broadcasting IBOC? It would seem they are.
(An editorial comment on iBiquity, the IBOC system used in the US: This is apparently a close proprietary solution and it looks like technical details of the modulation and coding are only available to those willing to pay a license fee and sign NDA agreements. Boo Hiss to the FCC for selecting a standard that is proprietary for OTA broadcasting on the public airwaves).

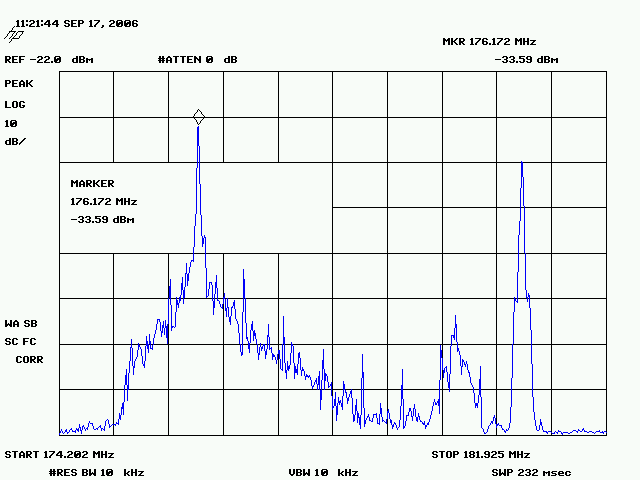
The plot below is of KTBC's (Channel 7) analog signal. Believe the carrier on the left is the video carrier and the one on the right is the audio subcarrier.

The plot below is of KTBC's Digital HDTV signal (channel 56). Shows the nice flat spectrum that seems to be typical of digital signals.

Comments to: Bill Tracey (kd5tfd@ewjt.com)
Last Updated: 17 September 2006 Copyright © Bill Tracey 2006