This page contains some pictures of scope waveforms I've captured from my 20 meter V5 SoftRock. Posted here to aid folks in debugging and understanding how this little radio works.
Do not be concerned if traces observed on your hardware do not match the traces shown here identically, there's room for a bit of variation from one board to the next.
These pictures were taken using a SoftRock V5, with a 14.060 MHz crystal.
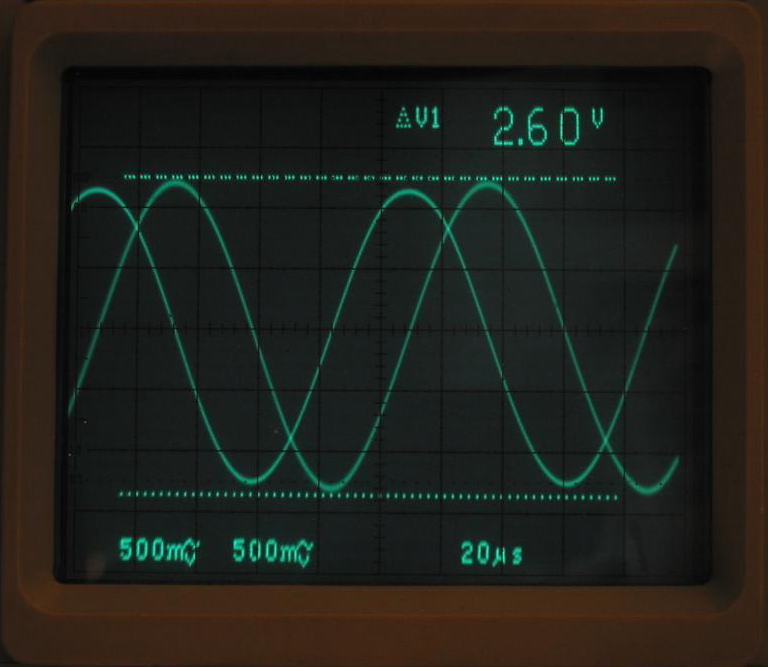
This trace is of the IQ Audio output when the antenna input is driven with a -21 dbm 14.065 MHz input. Phase relationship is showing approximately 90 degrees as expected, and amplitude balance between the two channels is good. This trace is captured from the IQ output terminals of the Soft Rock

These 2 traces show the outputs of the two comparators used to clock the QSD, showing a good 90 degree phase delay between the comparator inputs. These signals can be seen at pins 5 and 9 of the inter board connector.
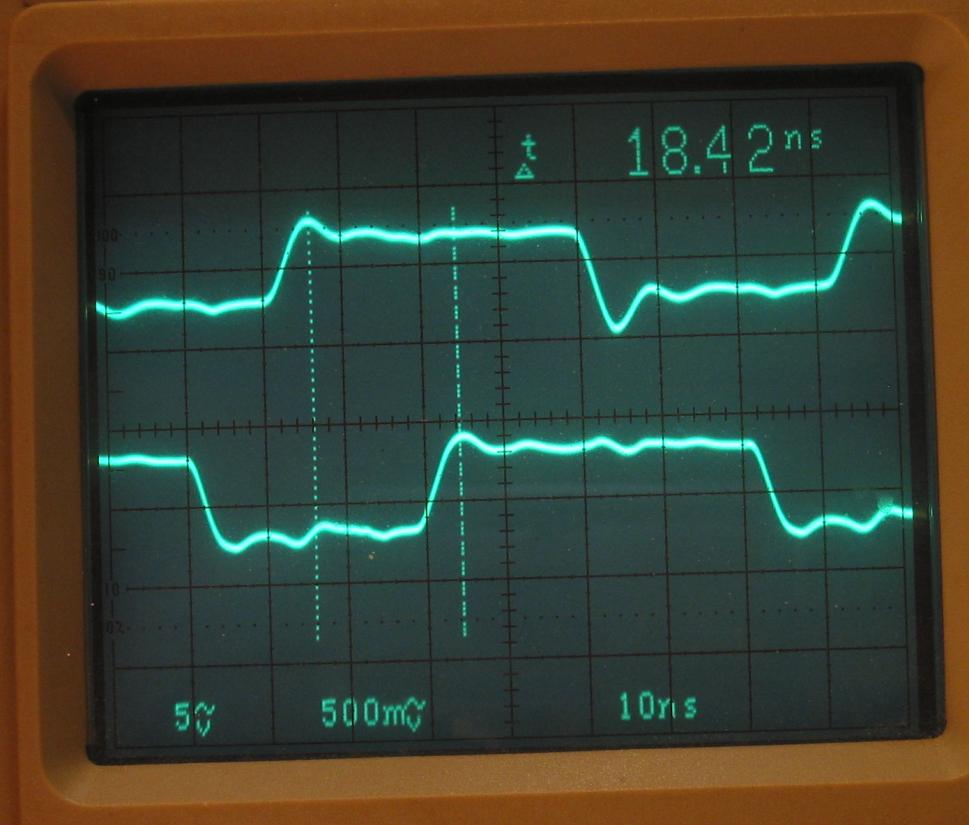
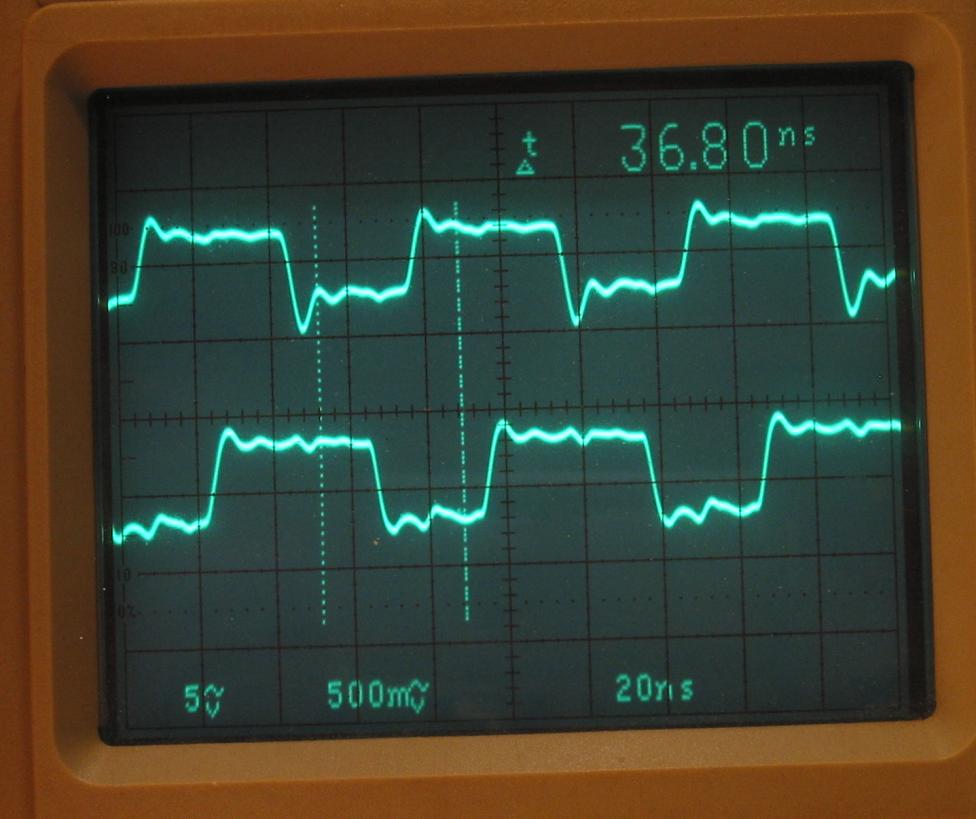
Note: Channel 2 is using a 10x probe the scope does not know about , so the indicator on the screen is incorrect for channel 2.
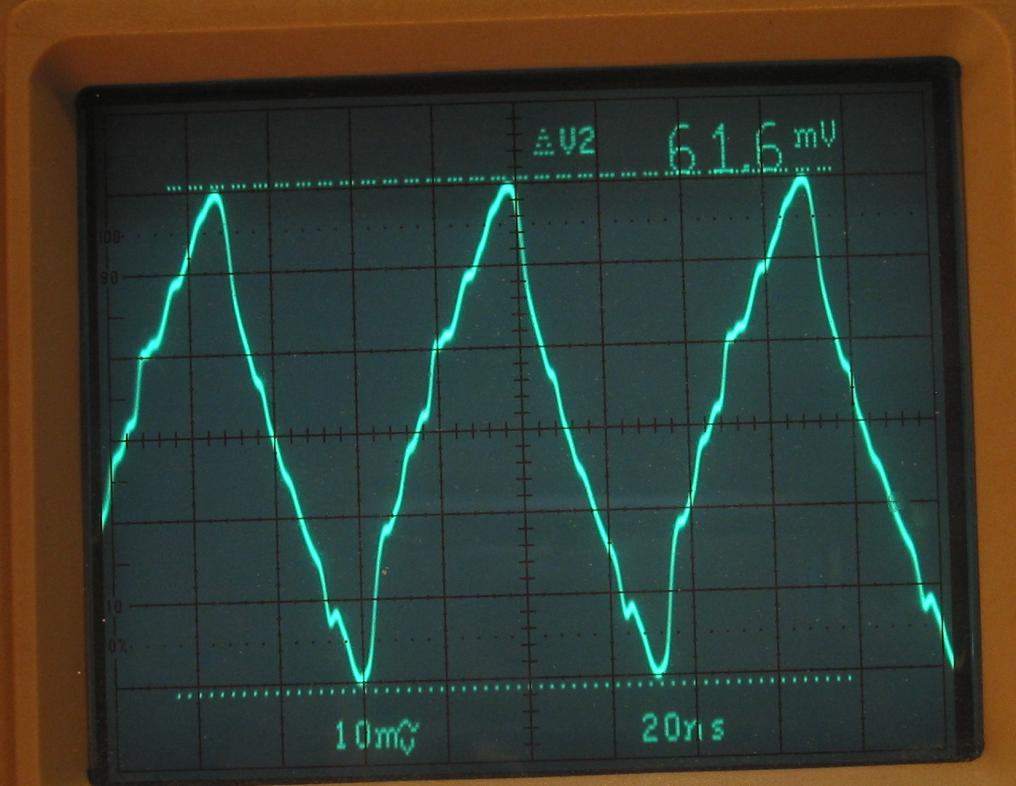
This trace shows the output of the oscillator that feeds the first comparator - bit of an ugly looking signal.
This signal can be seen at pin 4 of the inter board connector.
This was taken with a 10x probe, so indications on the screen need to be multiplied by 10 for actual values.
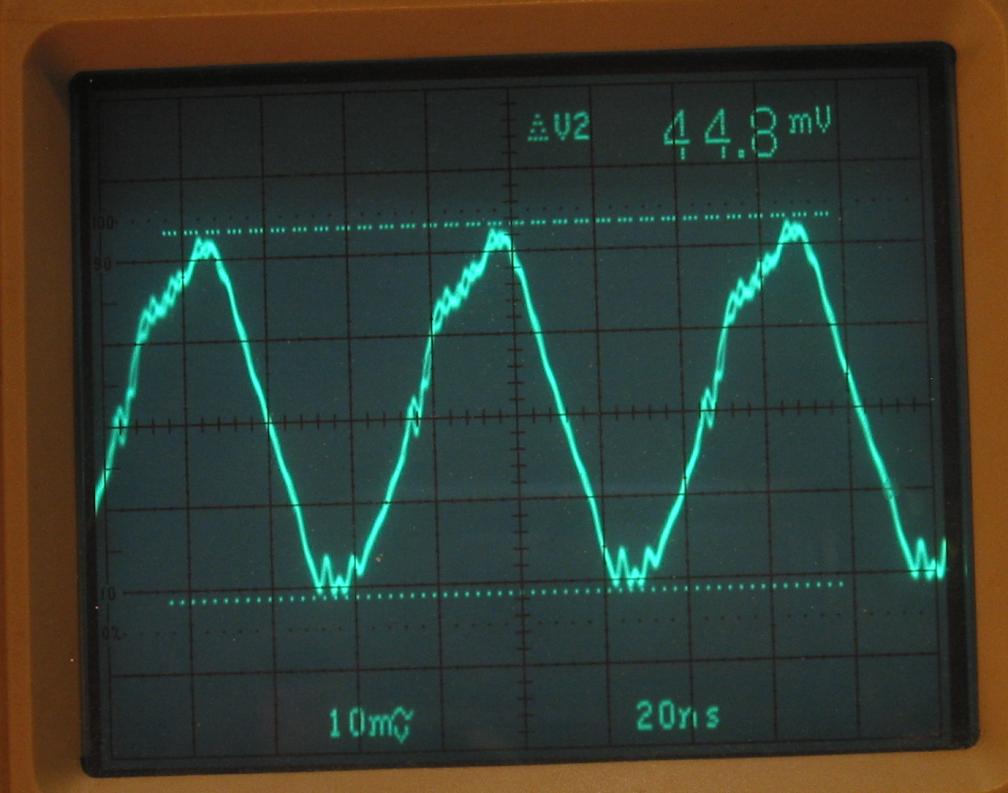
This trace shows the output of the phase delay/integrator feeding the 2nd comparator.
This signal can be seen at pin 6 of the inter board connector.
Also with a 10x probe, multiple screen display by 10 for actual value.
Comments to: Bill Tracey (kd5tfd@ewjt.com)
Last Updated 16
January 2006 Copyright © Bill Tracey 2006